3D and 2D Visualization Software
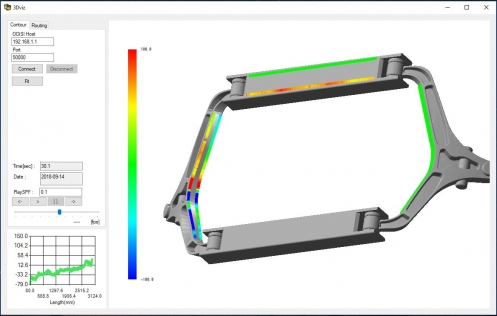
The 3DViz software provides intuitive 2D and 3D visualization of high-definition sensor data. The software allows strain or temperature data from an ODiSI system to be visualized directly on a 3D CAD model or a 2D image.
Product Description
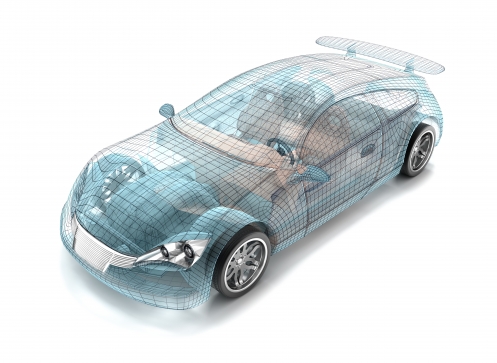
The 3DViz software provides graphical visualization of strain and temperature data acquired by an ODiSI system. Simply load an .stl or graphics file of the test article, map the fiber optic sensor routing onto the model or image, and then view color-coded temperature or strain data directly on the image or 3D model.
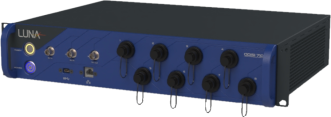
ODiSI strain and temperature data can be mapped and displayed in real time, by subscribing to sensor data streaming from a networked ODiSI 6000 Series system. Alternatively, ODiSI data can be loaded and replayed from a previously acquired ODiSI data. The sensor data visualization software can create videos of the evolution of strain and temperature over time to provide greater insight into designs.
Solutions and Applications

The ODISI system is the ideal solution for applications where more data and more detail can provide needed insight into materials, components, structures or processes.
Contact Sales to Learn More
Related Products

High-Definition Distributed Fiber Optic Sensing
ODiSI Interrogators
