Embedded Sensors Can Detect Damage in Composites
Combining very high strength with light weight, composite materials are finding their way into more and more structural and cosmetic parts within the aerospace and automotive industries. As composite use grows throughout these industries, efficient and effective methods of non-visual damage detection are needed. To meet this need, Luna has demonstrated that high spatial resolution (0.65 mm) fiber optic strain sensors incorporated into carbon fiber composite test articles can effectively detect damage from an impact by measuring a change in the strain profile, even when the impact causes fiber fracture and delaminations below the visible surface.
To test this method, a mock aircraft skin panel was fabricated to assess the distance over which the damage imparted to the panel propagates. The panel was fabricated from eight plies of 193 g/m2 3K plain weave fabric with a 19 mm foam core on the mid-plane. Optical fibers were embedded just below the outermost ply in three parallel passes spaced 1 cm apart.

The panel was then impacted to determine the relationship between fiber to impact distance and the strength of the induced fiber signal. A drop style impactor, similar to that which is used in ASTM D7136, was utilized to impart a quantifiable and controlled series of impacts. Strain measurements were achieved using Luna’s ODiSI system for high-definition fiber optic sensing (HD-FOS).
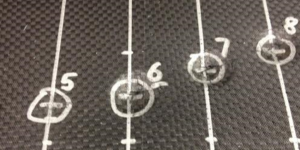
The following figure diagrams the location of 16 impacts. The initial eight impact events were conducted with the same impact parameters. The next six impacts (9-14) were spaced at larger horizontal spacing, and with less energy, to avoid conflating the results of the various impacts. Two final impacts were made at locations 15 and 16 between the bottom two fiber sections, to determine whether especially close proximity between the impact and the fiber altered the response.

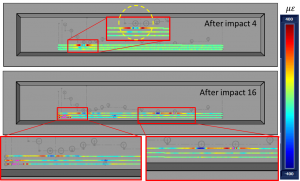
The following figure displays strain as a color map on a drawing of the panel after the 4th and 16th impact. Impact site 4 shows successively decreasing levels of strain propagating outwards from the impact location. The yellow circle traces the region of damage based on the reported strain. Note that the center of the circle is almost exactly over the impact location. The lower portion of the figure shows the cumulative damage resulting from all impacts performed on the impact panel. It is obvious that all impact events within ~5 cm of the fibers have resulted in a clearly discernible response in the strain profiles.


This research was partially funded by NASA through a Phase I SBIR. A paper on this work was published at the Composites and Advanced Materials Expo 2017, December 11-14, 2017. The full reference for the paper is:
Kominsky, Daniel., Rahim, Nur Aida Abdul., Davis, Matthew,. Garg, Naman., Castellucci, Matthew., Bryson, Reginald., Beaty, Noah., "Extracting Information from Damaged Carbon Fiber Composites Using High Definition Fiber Optic Sensing (HD-FOS)." Composites and Advanced Materials Expo 2017, December 11-14, 2017
For more information on other ways that the Luna ODiSI measurement system is helping to accelerate the adoption of composite materials, see this short application brief on High Definition Strain Sensing for Composites with HD-FOS.