3D Visualization Boosts Strain Data Interpretation and Application
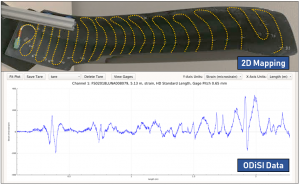 Plotting current strain along a sensor can easily be performed on complex components by Luna's ODiSI 6000 system. High Definition Fiber Optic Sensing (HD-FOS) provides a wealth of measurements, but these may only have meaning to those who were involved with the test unless preceded with thorough explanation.
Members of the design, testing or manufacturing teams need to understand the data, but they may be remote or unavailable for live testing. For some components, it can be challenging to completely understand the data without a more complete picture. This is where the benefits of 3D visualization become clear.
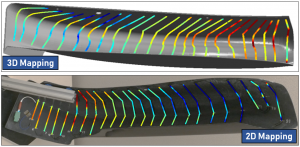 Luna's 3D Visualization Software Package can take ODiSI 6000 Series data and display it spatially on a 3D model or an image of the sensor layout, enabling flexible analysis for any test.
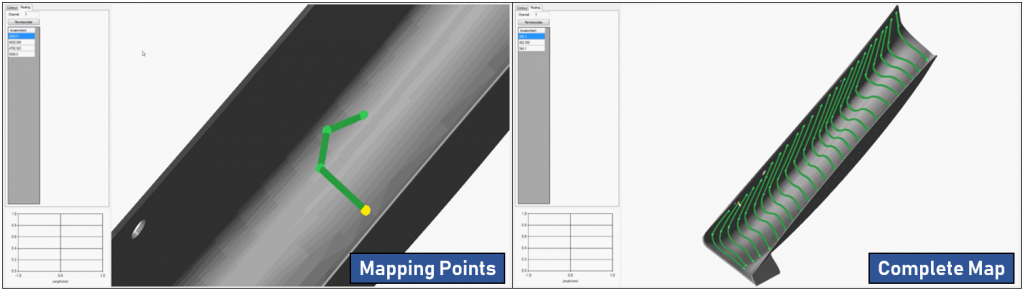
Points are mapped to the surface of the model and connected with line segments. The tester defines a location along the fiber for each point and the line segments interpolate the values between connected points. This allows the tester to see exactly where interesting things are happening on a component and convey the information more easily to others on the team.
Data is only valuable if it can be clearly shared with others. 3D visualization makes this easier than ever before.
See the ODiSI 6000 Series 3D Visualization software in action!