The Leading Edge - Observing Crack Strain with the FAA

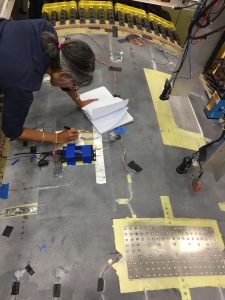
Luna engineers were invited to the Federal Aviation Administration (FAA) William J. Hughes Technical Center in Atlantic City to participate in testing an aircraft fuselage panel. Several issues related to the structural integrity of fuselage applications are being examined using the Full-Scale Aircraft Structural Test Evaluation and Research Lab (FASTER), including the fatigue and damage tolerance characteristics of current and emerging metallic and composite designs, performance of bonded and mechanically fastened repair technologies, assessment of conventional and emerging non-destructive inspection, and more advanced structural heath monitoring methods.
Luna engineers were able to showcase the ability of the ODiSI high-definition fiber optic sensing (HD-FOS) system to measure and map strain gradients in front of an intentional crack. The ODiSI’s measurements allowed the team to observe the strain gradients increasing at the crack front in real time as the panel was loaded biaxially in a load frame designed to replicate realistic flight load conditions.
Fiber Sensors in Front of the Crack
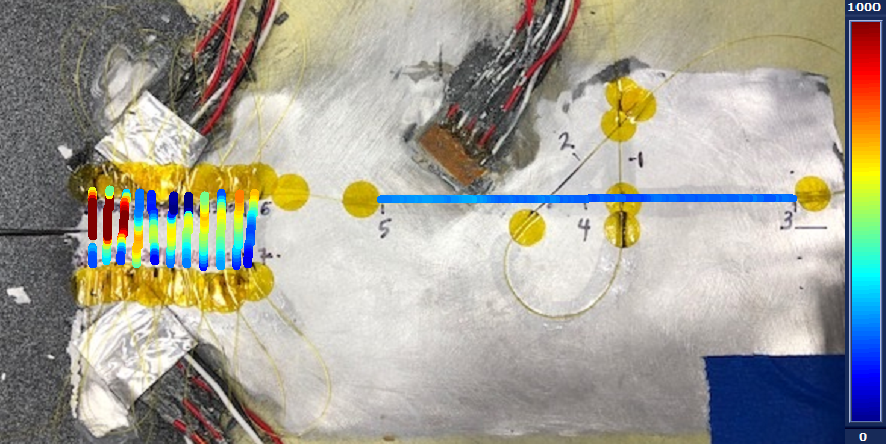
Straight fiber segments were laid 0.1 inches apart, perpendicular to the crack tip, in its path of propagation. This mimicked the layout of a 10-element strip strain gage sensor. Each straight section of fiber in front of the crack was approximately 2 cm in length, which is the equivalent of 30 strain gages per pass and over 300 sensors in total. Further to the right of the crack, engineers demonstrated the layout of a rosette configuration to obtain the principal strain magnitudes and directions.
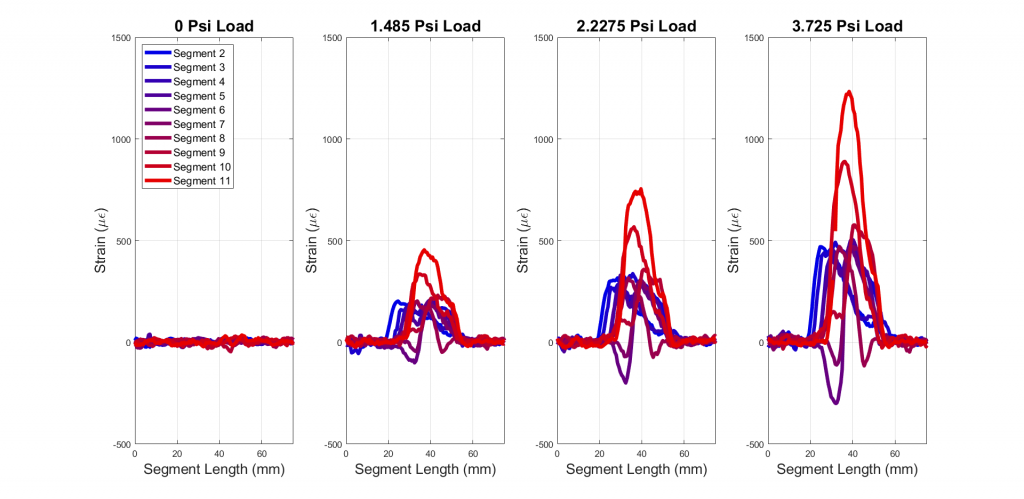
Strain Gradient Peaks in Front of the Crack and Decays with Distance
The resultant strain along each fiber segment of interest at 3.7125 psi is shown as a color map of strain overlaid on a photo of the part.

Further details of the strain gradient profile can be seen more clearly in this plot of strain along each straight segment at four loads.

The propagation of cracks can be slow at first, often taking weeks of accelerated loading before the part eventually violently fails. While the crack did not grow noticeably during Luna's time at the FAA, the ability to detect and monitor the effects of flaws such as cracks with such a high spatial resolution and density makes HD-FOS a valuable tool for structural health monitoring.
Learn More about ODiSI strain and temperature measurement system, or Contact Us to arrange a consultation with one of our engineers to see the ODiSI in action yourself.